
This is one of the Udacity Data Scientist Nanodegree Project. This project aims to use unsupervised learning techniques to identify segments of the population from the core customer base for a mail-order sales company in Germany. Therefore, these segments can then be used to direct marketing campaigns towards audiences with the highest expected rate of returns.
The techniques I used in this project include:
- Data cleaning
- Encoding and processing mixed-type feature
- Feature Scaling and Dimensionality Reduction
- Clustering
- Performance improvement with OpenBLAS
You can find the full analysis in my GitHub repo.
Data
The data files associated with this project (not included in this repository):
Udacity_AZDIAS_Subset.csv: Demographics data for the general population of Germany; 891,211 persons (rows) x 85 features (columns).Udacity_CUSTOMERS_Subset.csv: Demographics data for customers of a mail-order company; 191,652 persons (rows) x 85 features (columns).Data_Dictionary.md: Detailed information file about the features in the provided datasets.AZDIAS_Feature_Summary.csv: Summary of feature attributes for demographics data; 85 features (rows) x 4 columns
Analysis Structure
- Data exploration and data cleaning (85% of the analysis)
- Feature Engineering (One Hot, Scaling, and PCA)
- Clustering with k-means
Conclusion
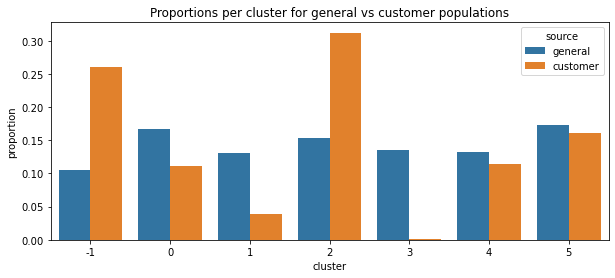
I use the elbow method to find that 6 is the optimal number for clustering, which means the model segments customers and the general population into 61 groups. We can find the proportion of customers in cluster 2 is higher than the general population, which suggests people in cluster 2 are the target audience. We also find that, in cluster 3, the customer is underrepresented, which means people in that group are outside of the target demographics.
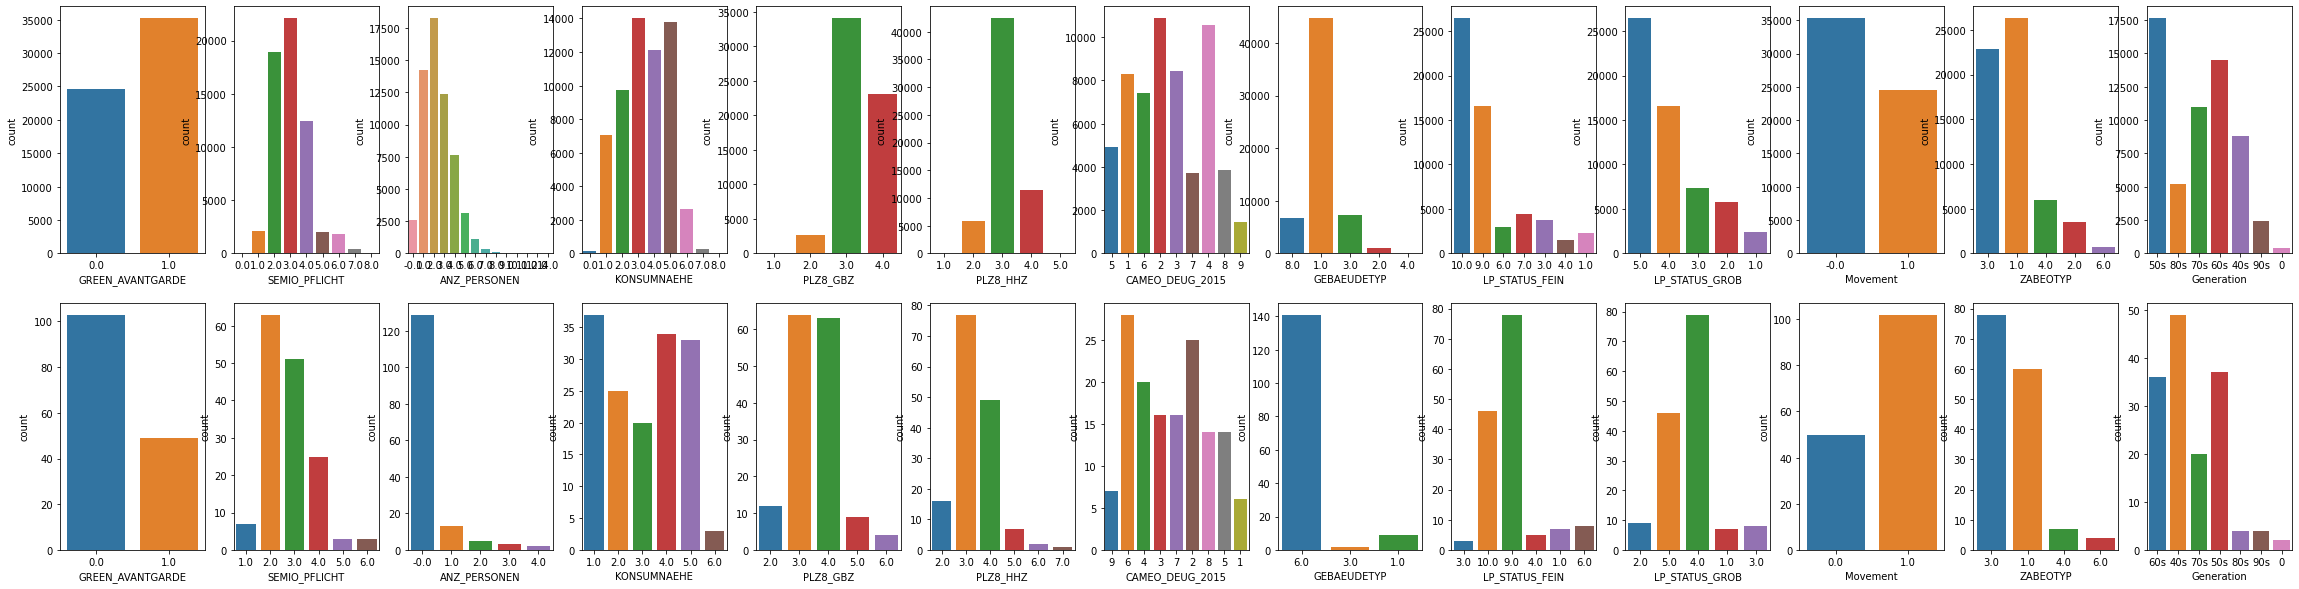
Comparing 2 segments, we can find there are some key differences. For example:
- Distance from building to point of sale: People in cluster 3 are closer to Pos then people in cluster 2.
- Wealth / Life Stage Typology: More people in cluster 2 are upper class
- Type of Building: Most builds in cluster 2 are residential build.
- Social status: Most people in cluster 2 are top earners and most people in cluster 3 are house owners.
|
|
Licensing and Acknowledgements
Udacity Data Scientist provided the starting code for this project. Udacity partners at Bertelsmann Arvato Analytics provided the data.
-
Cluster -1 is the group I added for checking the proportion of data that miss more than 30% information. ↩︎